A primer on Python's event loop, the GIL, and how one blocked loop stalled our MCP server. Part 1 of our MCP re-architecture series.
Chris Blanton · November 5, 2026 · 5 min read
103 s → 7.0 s
15×
faster p95 for heavy data queries, load-tested at 64× production traffic
22.4 s → 1.7 s
13×
less event-loop stall per pod, per minute, in the same 64× load test
was 16×
65×
production traffic held with clean latency in load tests
with Claude Code
4 days
from first commit to a load-tested rewrite
The event loop and the GIL
An async Python server runs one event loop per process. While one request waits on the network, the loop runs another. Anything that holds the loop, such as a synchronous database call or a big serialization, makes every other request on the process wait, health checks included.
Moving the work to a thread doesn’t always help. The global interpreter lock (GIL) lets only one thread run Python at a time, and CPU-heavy library calls like pandas transforms can hold it, so the loop still can’t run. More pods don’t help either: each one is another single loop that stalls the same way.
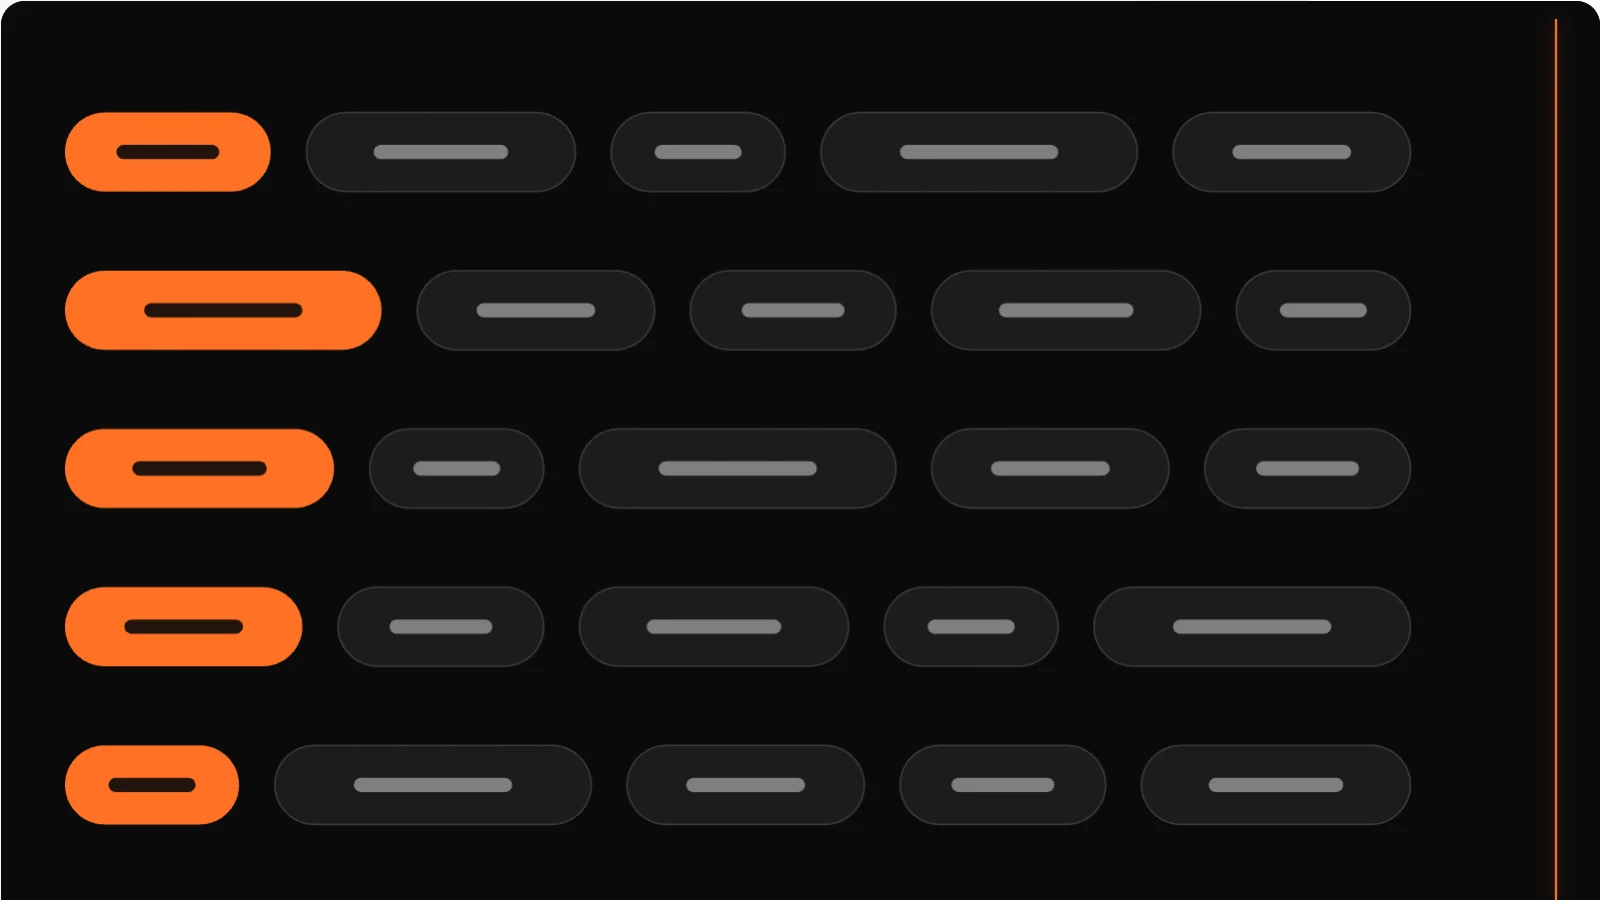
Illustrative. Each bar is one pod's event loop; orange slices are requests A to D taking turns. A synchronous call holds the loop until it returns. A CPU-heavy library call in a thread can hold the GIL the same way, so the loop thread can't run either.
What it looked like
MCP usage is growing quickly as more clients connect AI agents straight to our data. Handling today’s traffic isn’t enough: to meet that demand, the server has to absorb many times it without slowing down. So we load-test well past today’s peak, stepping traffic up in multiples of our average production rate.
In those load tests, at 64× average production traffic, each old-build pod’s loop was stalled 22 seconds of every minute, with over a thousand tasks queued behind it, on 1 to 1.8 of its 4 cores. Quick lookups went from under 0.3 seconds to about 20, and our traces blamed the dependencies.
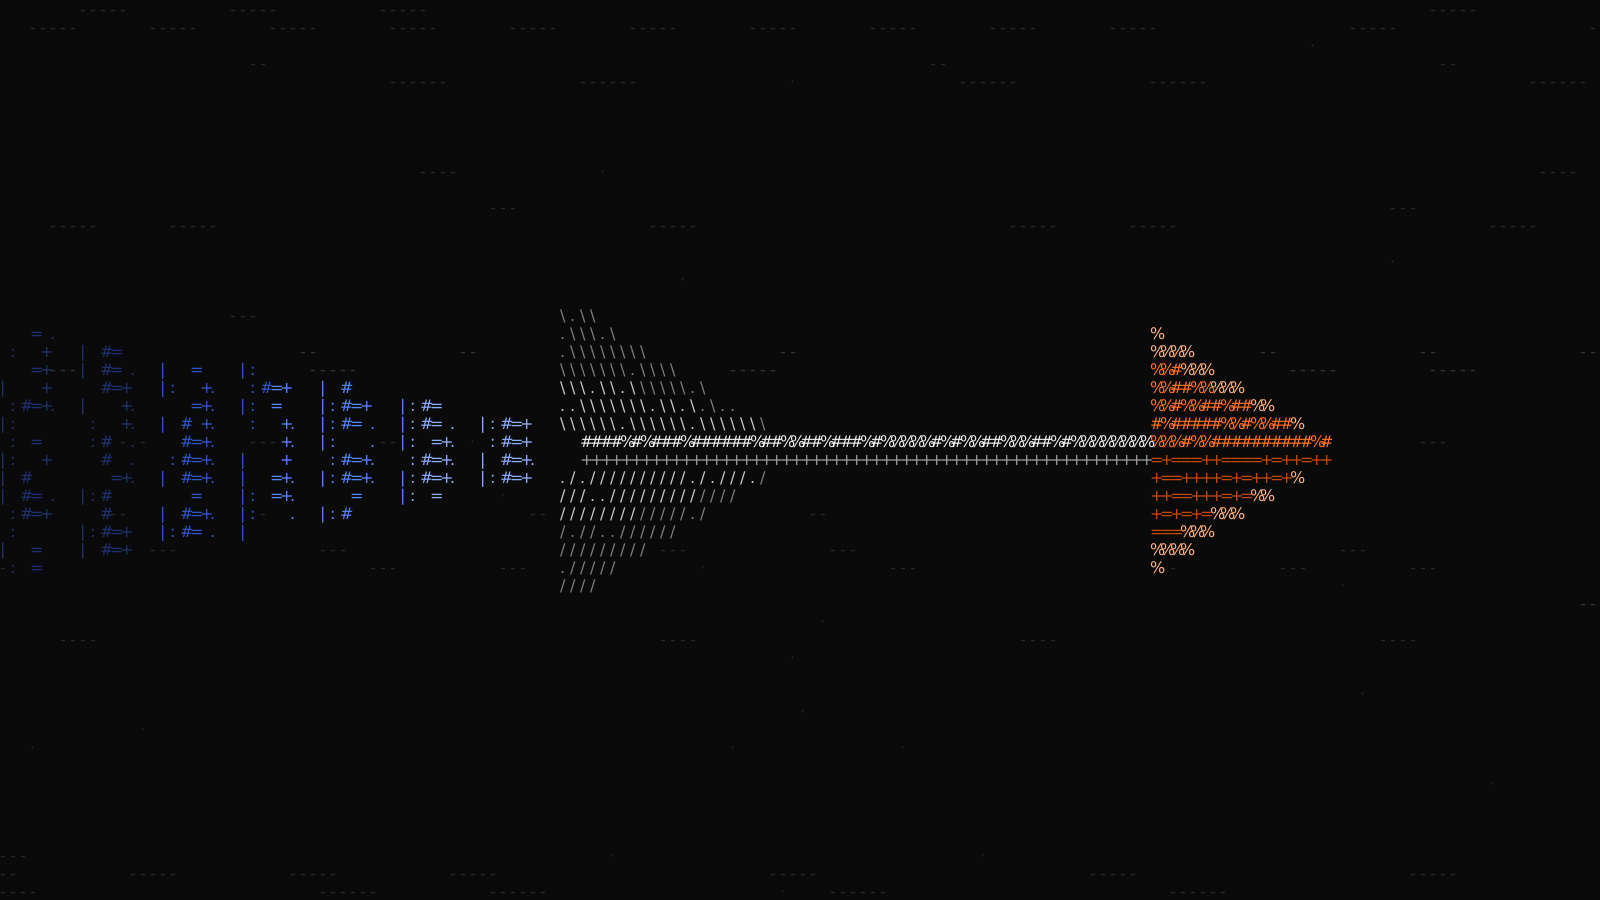
The span is the old build's quick-lookup p95 at 64× traffic. The split inside it is illustrative: the call itself was quick, and the rest was time spent queued behind a blocked loop, which the span can't tell apart.
Blocking also chained across services. Every MCP request checked the caller with the auth and billing service, through a synchronous call on the loop, and that service’s own loop was blocked by synchronous database calls. It stalled under load in August, and every MCP pod waiting on it stalled too.
Every MCP request checked the caller with the auth service. That check was a synchronous HTTP call on the MCP pod's loop, and the auth service's own loop was blocked by synchronous database calls. Any slowness at the end of the chain froze every request on the MCP pod.
Finding it
Three checks, from production-like load down to a single route. Part 3 of this series covers them in detail.
Fixing it
Off the loop. Synchronous calls moved to threads, and clients are reused instead of rebuilt on every call.
Cached auth. A per-token cache cut auth service lookups from 39,540 to 934 while serving almost 3× the requests.
Rewriting it
Each fix helped, but what remained was CPU-heavy Python holding the GIL on a single loop, and no patch fixes that. In mid-October we stopped patching and redesigned the server. With Claude Code, the rewrite reached a load-tested build matching the old one in four days.
Six weeks of fixes on the old design, then four days from first commit to a load-tested rewrite, written with Claude Code.
of 175 commits
161
written with Claude Code
files
528
touched by the rewrite
−4.3k lines
+56k
added and removed
Oct 18 → Oct 28
10 days
of review before merging to main
Groundwork already in place made the split fast:
One tool runner. Admission, time budget, metrics and billing for every tool call live in one place, so the router only had to swap in a call to a worker there.
Leaner heavy queries. Arrow batches cut a 1.2-million-row fetch from 1,364 MB to 346 MB at peak, and aggregating in SQL took the heaviest framework from 1.4 GB to 7 MB.
Async query jobs. Long queries are submitted and retrieved later instead of holding a connection open.
The rewrite splits the server in two. Routers handle the protocol and auth and forward tool calls over gRPC. Workers run the tools and scale out on their own. CPU-only PyTorch and the split shrank the images too.
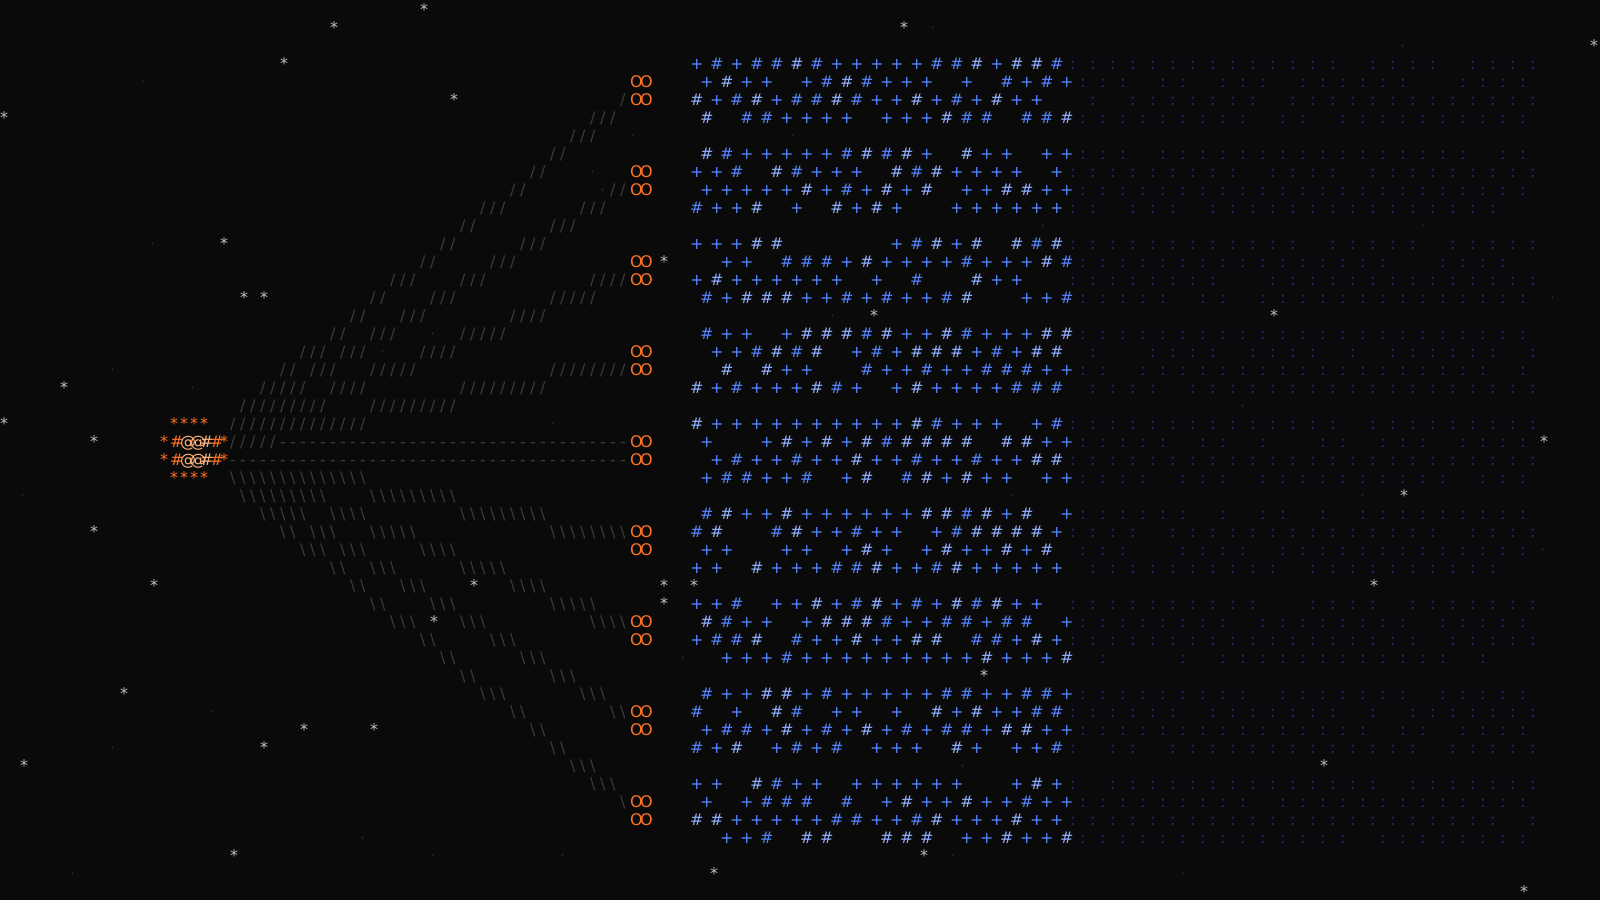
Before, protocol, auth and every tool shared one event loop per pod. After, small routers handle the protocol and cached auth and send tool calls over gRPC to workers, which scale out on their own.
Image sizes are compressed, from our registry. Auth lookups are the auth service's own request counts over each full scorecard run; the new build served almost 3× the requests with under 3% of the lookups.
Results
Both builds ran on the same test stack on November 3 and 4, 2026, with load stepped every six minutes as a multiple of average production traffic. Old build: today’s production image on four pods. New build: two routers and four workers.
p95 response time by load, log scale. Old build: production image on four pods. New build: two routers and four workers. Same test stack, November 3–4, 2026.
Seconds per minute each pod's event loop was stalled, from the loop-lag monitor. Old build: four pods. New build: four workers and two routers.
At 64× production traffic
Old build
New build
Heavy data query, p95
103 s
7.0 s
Quick lookups, p95
18–22 s
0.26–0.31 s
Tool calls that failed
12%
1.9%
Loop stall per pod, per minute
22.4 s
1.7 s
The new build ran with settings tuned for it, such as more worker memory and lighter trace sampling. Above 64×, both builds hit the test environment’s smaller StarRocks warehouse, so 65× is a floor. For the database side, see Prathyush Shankar’s post on materialized views.
In this series
Adding Pods Didn’t Help (this post)
Our Spans Were Lying: tracing under a blocked loop and the GIL (coming soon)
Measuring the Stall: the loop-lag monitor and dependency sweeps (coming soon)
A Fair Fight: load tests you can compare (coming soon)
Off the Loop: the fixes and the caching (coming soon)
Routers and Workers: scaling out, memory and moving the encoder (coming soon)1
Footnotes
Longer term, we are designing a data-processing service in Go with DuckDB, with no GIL. It is a design today, not a result. ↩